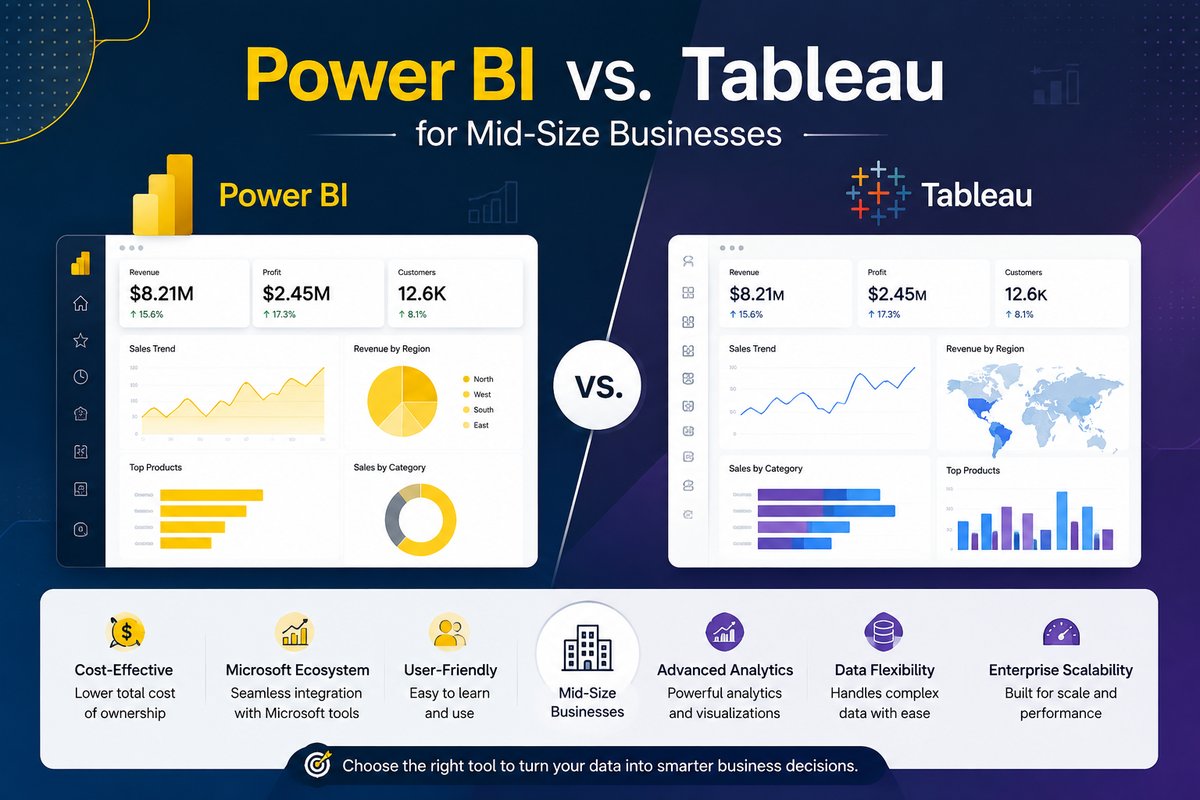
Both Power BI and Tableau can build the dashboards mid-size businesses need. The right choice usually comes down to three things: what's already in your software stack, how technical your team is, and how much you're willing to spend per user.
Quick Comparison
| Factor | Power BI | Tableau |
|---|
| Best fit | Microsoft-centric stacks (Excel, Dynamics, Azure) | Complex, large, or varied data sources |
| Learning curve | Lower — familiar for Excel users | Steeper, more powerful visual customization |
| Pricing | Lower per-user cost | Generally higher per-user cost |
| Visual flexibility | Good, template-driven | Excellent, highly customizable |
| Governance & scale | Strong within Microsoft 365 environments | Strong for large, multi-source enterprise data |
Choose Power BI If
- Your team already lives in Excel, Outlook, and the Microsoft 365 suite.
- You want a lower entry cost with a shorter learning curve for non-technical staff.
- Your data mostly comes from a small number of connected systems (Zoho, Odoo, SQL, Excel).
Choose Tableau If
- You need highly customized, presentation-grade visualizations for external or board-level reporting.
- Your data comes from many disparate sources and needs advanced blending.
- You have (or plan to hire) a dedicated analyst who can invest in learning the platform deeply.
What Actually Matters More Than the Tool
Neither platform fixes a bad data model. Before choosing between them, get clear on what questions the dashboard needs to answer, which systems the data lives in today, and who will actually maintain the reports after go-live. A well-modeled Power BI dashboard will beat a poorly modeled Tableau one every time — and vice versa.
The Cost Question Nobody Asks Upfront
Per-user licensing is only part of the total cost. Factor in implementation time to connect your actual data sources cleanly, the learning curve cost of your team's time during ramp-up, and ongoing maintenance as your business systems change. A cheaper per-seat price on paper can end up costing more overall if the implementation drags on because the underlying data wasn't modeled properly first — which is a services problem, not a licensing one.
A Third Option Worth Knowing
For businesses already running on AWS infrastructure, or wanting a lighter-weight, pay-per-session pricing model instead of a flat per-user license, Amazon QuickSight is worth evaluating alongside Power BI and Tableau. It's less commonly considered, but for the right infrastructure setup it can be the more cost-effective choice at scale.
Mistakes That Undermine Either Platform
- Connecting live to messy source systems instead of building a clean data layer first — every inconsistency in the source data shows up directly in the dashboard.
- Building dashboards nobody asked for. The most technically impressive dashboard is worthless if it doesn't answer the question a manager actually needed answered.
- No plan for who maintains it. Source systems change — new product categories, new sales regions, new fields. Dashboards need an owner who updates them accordingly, not a one-time build that slowly goes stale.
Questions Worth Asking Before You Decide
Rather than starting with "Power BI or Tableau," start with: what decision is this dashboard actually meant to support, and how often does that decision get made? A daily operational dashboard has different requirements than a monthly board report. Who besides you will need to build or edit reports once you're not the one doing it — and does that person already know Excel-style formulas (favoring Power BI) or want deeper visual customization (favoring Tableau)? Answering these first usually makes the platform choice obvious, rather than the other way around.
How SysVera Helps
We build the data model first — connecting Zoho, Odoo, or your other systems cleanly — then choose the visualization layer that fits your team and budget, whether that's Power BI, Tableau, or Amazon QuickSight.
Not sure where to start?
Tell us your setup — we'll map the right next step for your business.
Get In Touch →